Asset Screener Overview
Messari’s Asset Screener allows you to sift through over 30,000 Assets with advanced filtering across 50+ metrics, and then analyze your results in customizable tables. Use the Asset Screener to uncover potential investments, identify trends, monitor the competition, and much more by creating and customizing screens, applying advanced filters, and customizing columns. This page includes a step-by-step guide on getting the most from Messari’sAsset Screener , along with hot tips for success and FAQs collected from Messari subscribers. Be sure to check out the full Video Library for detailed walkthrough videos. Check out the Messari Fundraising Screener and associated documentation for screening across the most complete and reliable Fundraising dataset on the market.🚧The Asset Screener is currently available for Messari Pro and Enterprise subscribers. Lite subscribers have limited access. Please visit our Pricing page to compare plans or Contact Us if you have any questions.
Asset Screener Videos
Asset Screener: Walkthrough
Asset Screener: Filtering & Transformations
Access Screener
SelectScreener from the top navigation on your Messari dashboard to jump to the Screener Homepage.

Create a New Screen
Click onCreate New Screen in the top left-hand corner.
A pop-up will appear asking you to select the type of screener: Assets Screen, Investor Screen, or Deal Screen. In this case choose Assets Screen. Visit our Fundraising Screener page to learn more about the Investor or Deals Screens!

Duplicate a Sample Screen
Under the Messari Screens section of the left-hand navigation you will find over 50 samples. Selecting one will open it in read-only mode, and you can selectDuplicate in the top right corner to make a copy.

- Gainers and Losers: Track over and under performers across customizable timeframes
- Ecosystems: Start screening with your favorite ecosystem’s full asset list
- Categories: Leverage the powerful Messari Classification System to screen by Category
- Time Machine: Use powerful advanced filters for historical views into market action
- Exchanges Coverage: Filter and compare Assets across their exchange listing
Save and Share Screens
Changes will NOT save automatically. Give your screen a name and clickSave in the top right-hand corner often!

Save to duplicate, revert to the last saved version, copy a link for sharing, edit, or delete your screen

My Screens
Once a screen has been saved they are available for access on theHome view or in the sidebar navigation under My Screens.

Customize Your Screen
Add Screen Filters
On your New or Duplicated Screen selectNew Filter to customize.
- Scroll through the available metrics or use the search bar to find your desired filter. The sections at the top make it easy to find the metrics you need. Hover over the
ito the left of the metric name for a full definition.

- Select the operator. For example, on a qualitative filter such as
Categoryyou can selectIsorIs Not.

- Select the comparison criteria. Depending on the initial metric selected, the comparison criteria could include a picklist of choices, a static value, or another metric (Visit the Advanced Filters and Columns section below to learn more).

Customize Column Views
Use Preset Column Views
Each Assets Screen will start with pre-made column Views for quick review of your results These Views are built with metrics applicable to the type of Screen you are creating. For example, to quickly review the results of an Investors Screen, pre-made views include an Overview, Investment Behavior, Investment Count by Year, and Round Amount Stats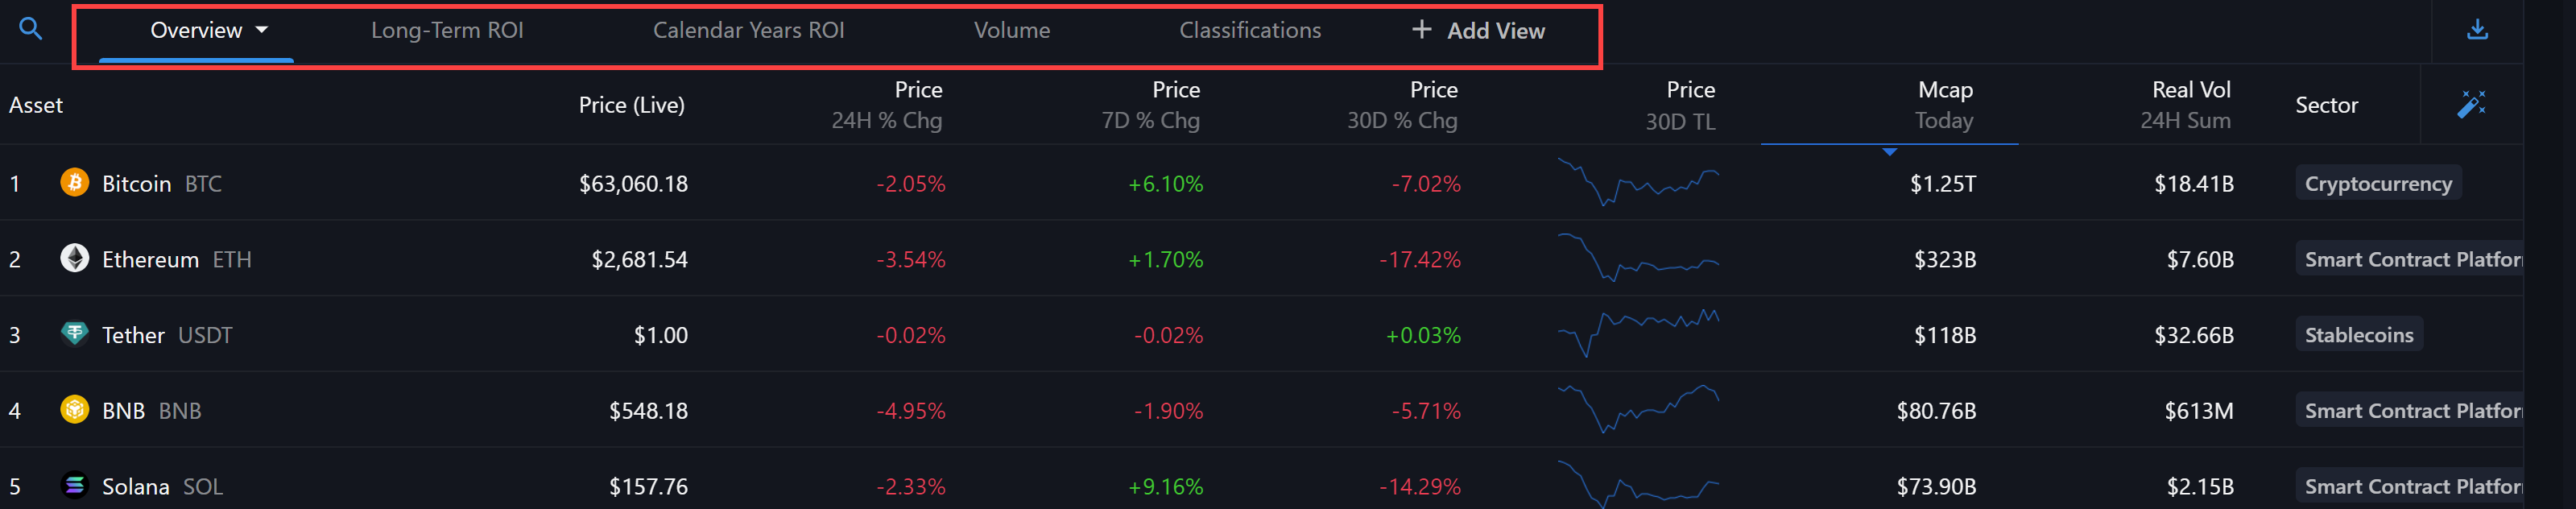
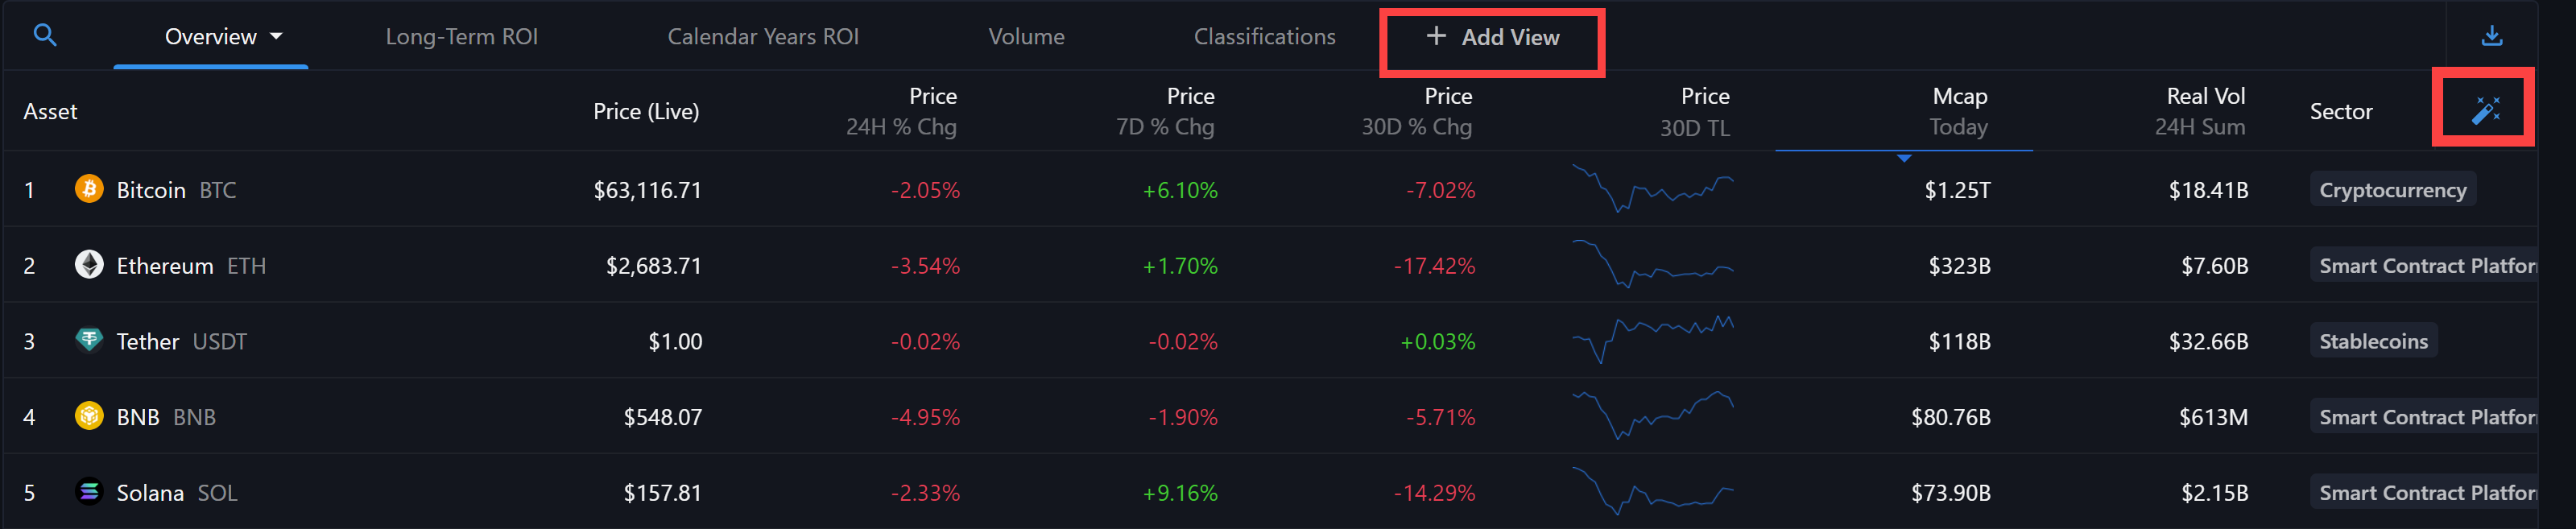
Manage Columns
ClickAdd View to create a new view, or use the blue wand icon in the top right corner of the results table to edit the columns on your current view.
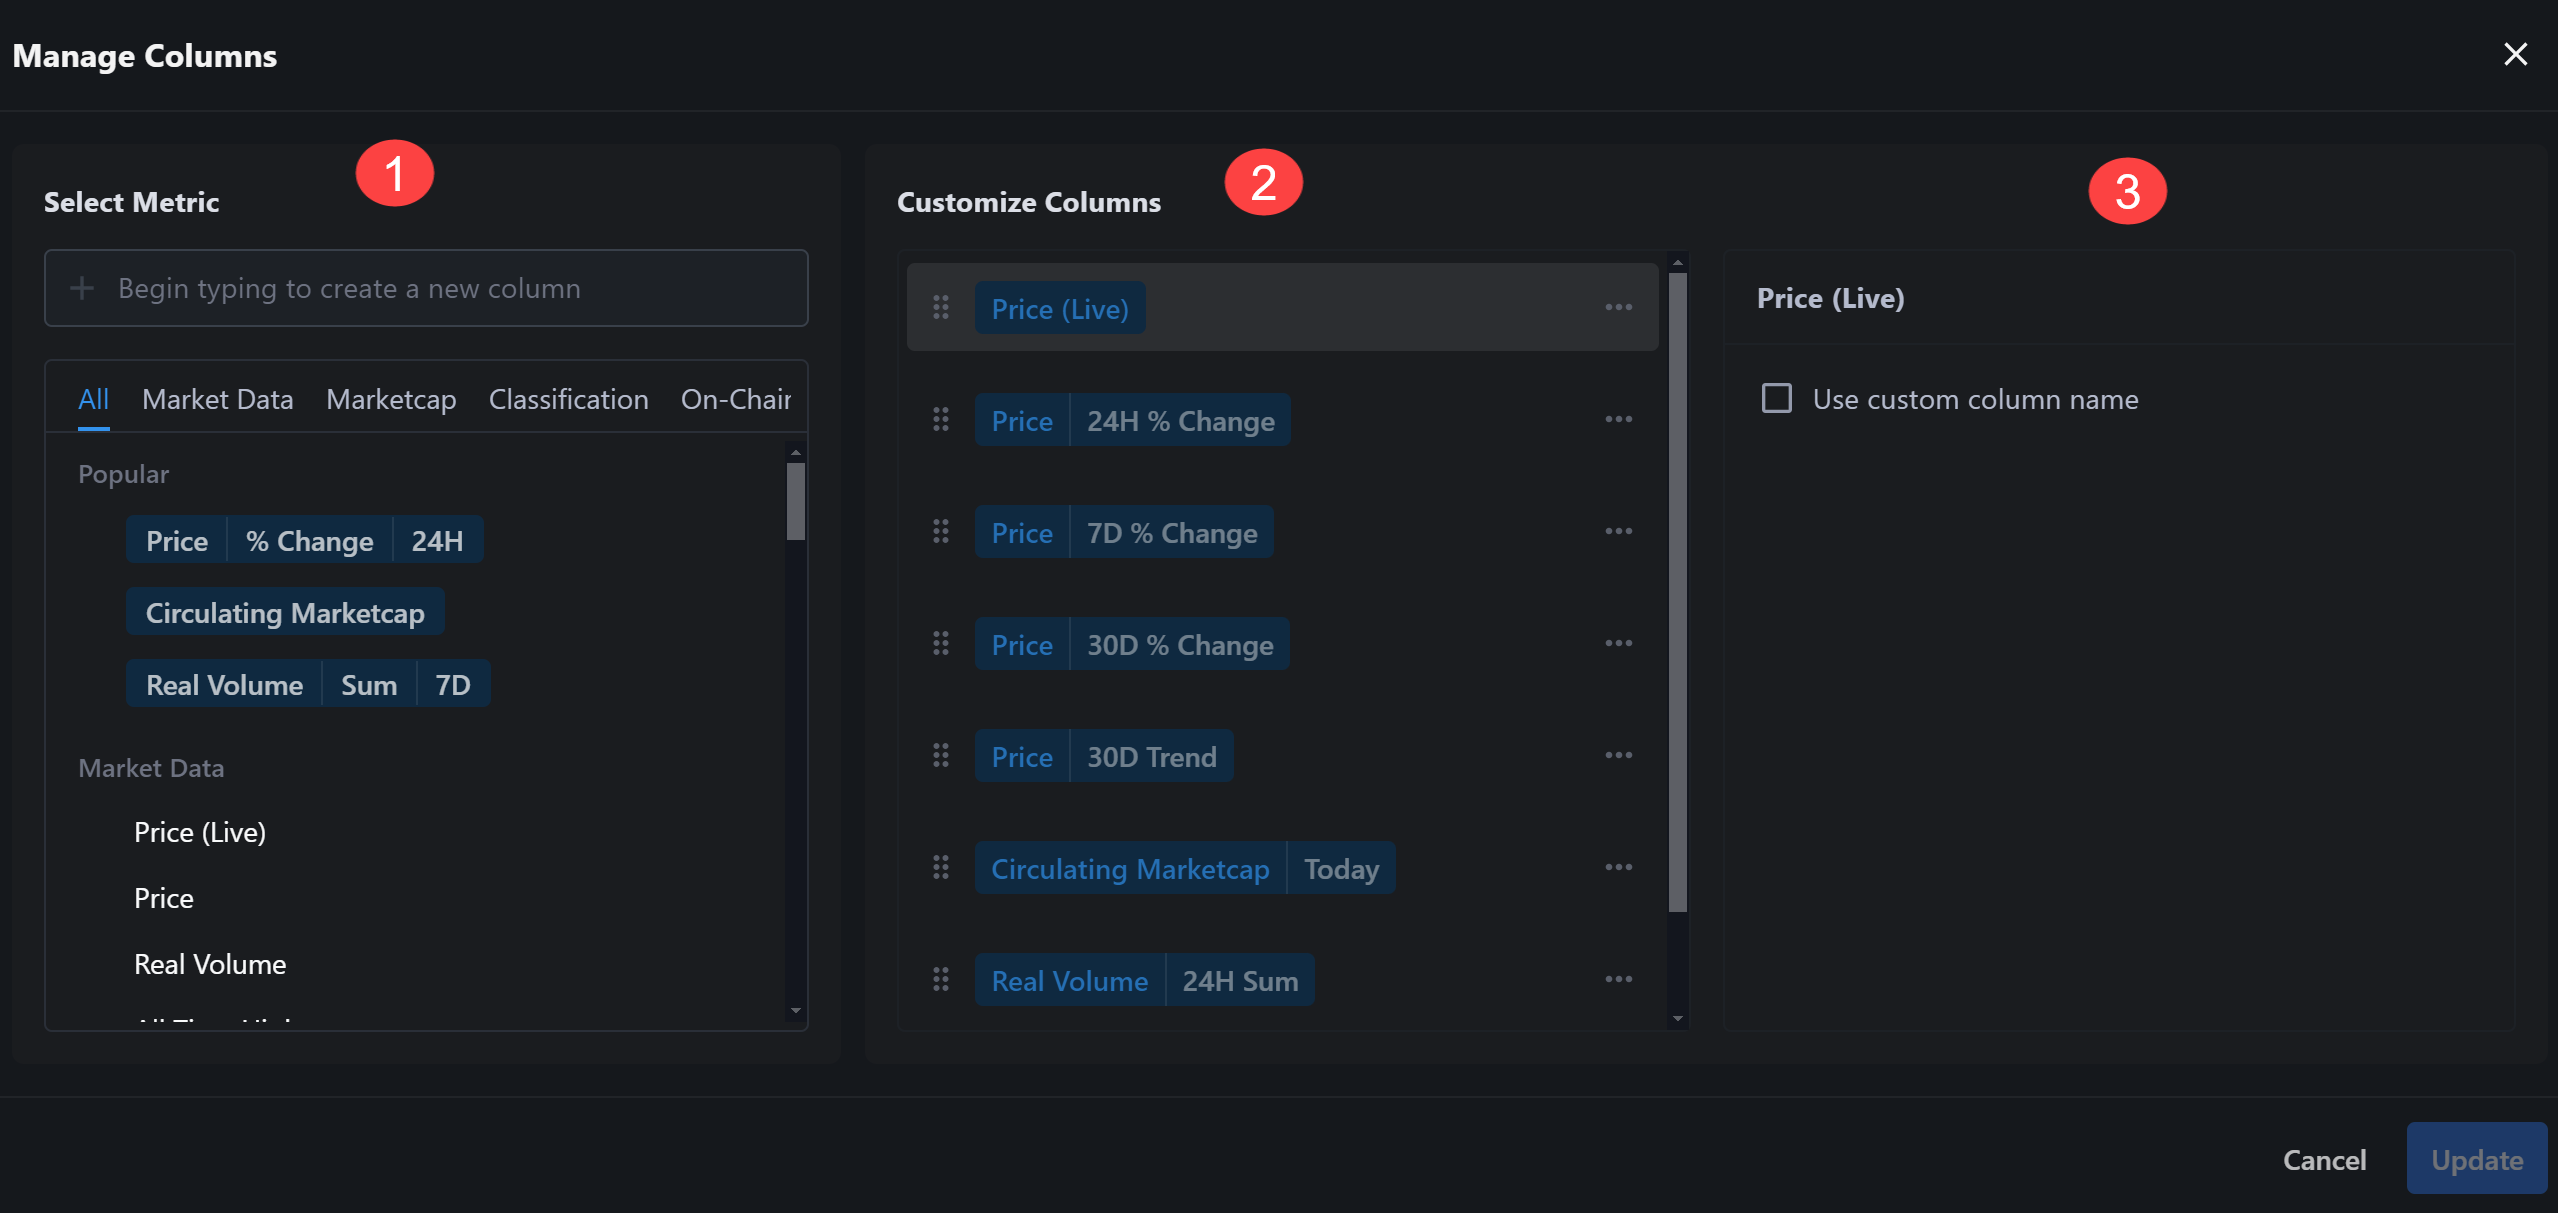
- Click
Addon the metric you would like to add as a column. The same metrics that were available as filters are also available as columns. - The middle section for Customize Columns allows you to click the six dots to the left of the column name to drag and drop into a new position. Or, use the three-dot menu on each column name to Duplicate or Delete.
- After selecting the column you want to edit in the second section, the third section allows you to input a custom column name. If applicable you can apply an advanced filter, known as a Transformation (Visit the Advanced Filters and Columns section below to learn more).
Advanced Filters and Columns
Advanced Filtering, known as Transformations, allow you to fully unleash the power of Messari’s Asset Screener. Check out the sample screens to explore what can be achieved through Transformations. These can be applied to metrics in the filtering stage OR applied to metrics that are used in column Views. Not all metrics can be used in Transformations, and anFx icon will appear next to the field added when it is available.

Types of Transformations
TheFx icon will allow you to manipulate the metric in the following ways:

- On a specific date: Filter based on the price or market cap of an asset on a specific date in the past.
- Sum: Filter based on the cumulative sum of a given over a defined time-period. Only available for cumulative metrics.
- Average: Filter based on the average of a given metric over a defined time-period
- Min: Filter based on the minimum value of a given metric over a defined time-period
- Max: Filter based on the maximum value of a given metric over a defined time-period
- Median: Filter based on the median of a given metric over a defined time-period
- Change: Filter based on the absolute change of a given metric over a defined time-period. Available for Price, Marketcap and other metrics.
- % Change: Filter based on the percentage change of a given metric over a defined time-period. Available for Price, Marketcap and other metrics.
Define Time Periods
The transformations above are defined over the following time periods:
- Last X days or hours:: Hour-based timeframes are only available for Price and Volume metrics.
- Specific Year
- To date: Month-to-Date, Quarter-to-Date, Year-to-Date
- Custom timeframe: Select an interval Between two custom dates, or Since a specific date
Apply Transformations
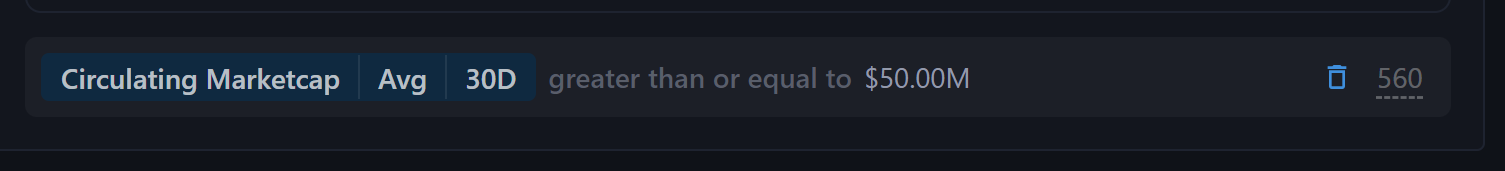
As an example of a commonly used Transformation we can apply a filter for the Average 30 day Circulating Market Cap greater than or equal to $50MM.- Start the transformation process by selecting the metric of
Circulating Marketcap - Select the
Fxicon and toggle on the box for Apply a Transformation - For
Avginput 30 and confirm the dropdown is set toDays - Click Apply to advance

- Choose the operator
Greater than or equal to

- Type in the comparison value of 50,000,000 and hit Enter to apply the filter

- Note the count to the right of your filter indicating the number of Assets that match your criteria. Click on the filter to edit or utilize the trash can icon to delete.
Compare Transformations against Transformations
The Transformation capabilities are incredibly powerful on their own when choosing your screening criteria. These values can be compared to specified static values. But the most advanced use case allows for the ability to compare a Transformation to another Transformation. This example will adjust the statis value of $50MM above to the Average Circulating Marketcap of 2023.- Click into the filter to edit and delete the manually typed 50,000,000
- Choose
Circulating Marketcapagain and toggle the icon for Apply a Transformation - Select the
Specific Yeartimeframe and input 2023
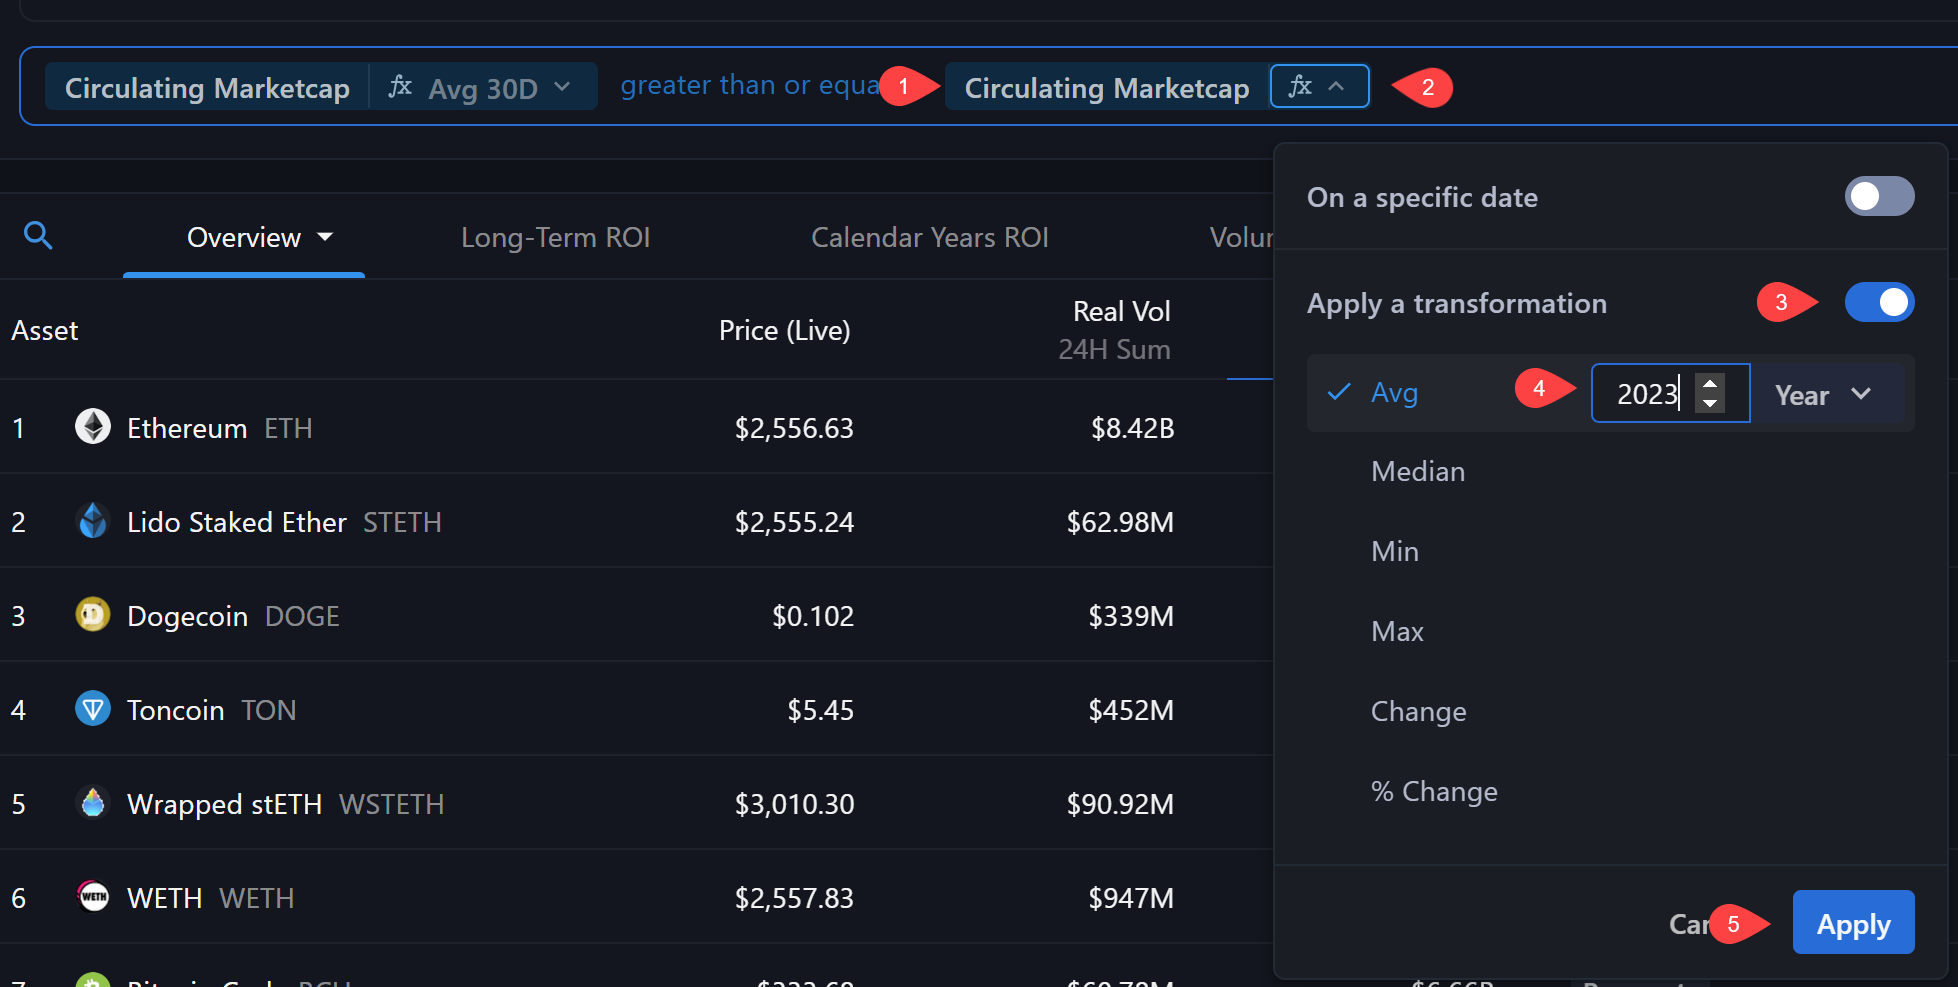
- After selecting
Applyto lock in your changes, the final step is to click the checkmark icon to update the results table.

- Price AVG (50D) greater than Price AVG (200D)
- Price % Change since a given Date lower than the Price % Change YTD
- Real Volume SUM (30D) greater than $1b
Transformations as Columns
Metric Transformations can be applied in Columns as well. Remember, the filters and columns are fully customizable and they do not have to be the same. You can filter by certain metrics and view columns with completely different metrics. For this example, the standard Overview template contains multiple transformations as columns. These can be edited in two ways.Manage Columns
First, using the wand icon in the top right corner of the display table you are able to access the Manage Columns dialog box. Transformations can be identified in the middle column by the gray text indicating the type and timeframe. By selecting a column you are able to make adjustments in the right hand panel.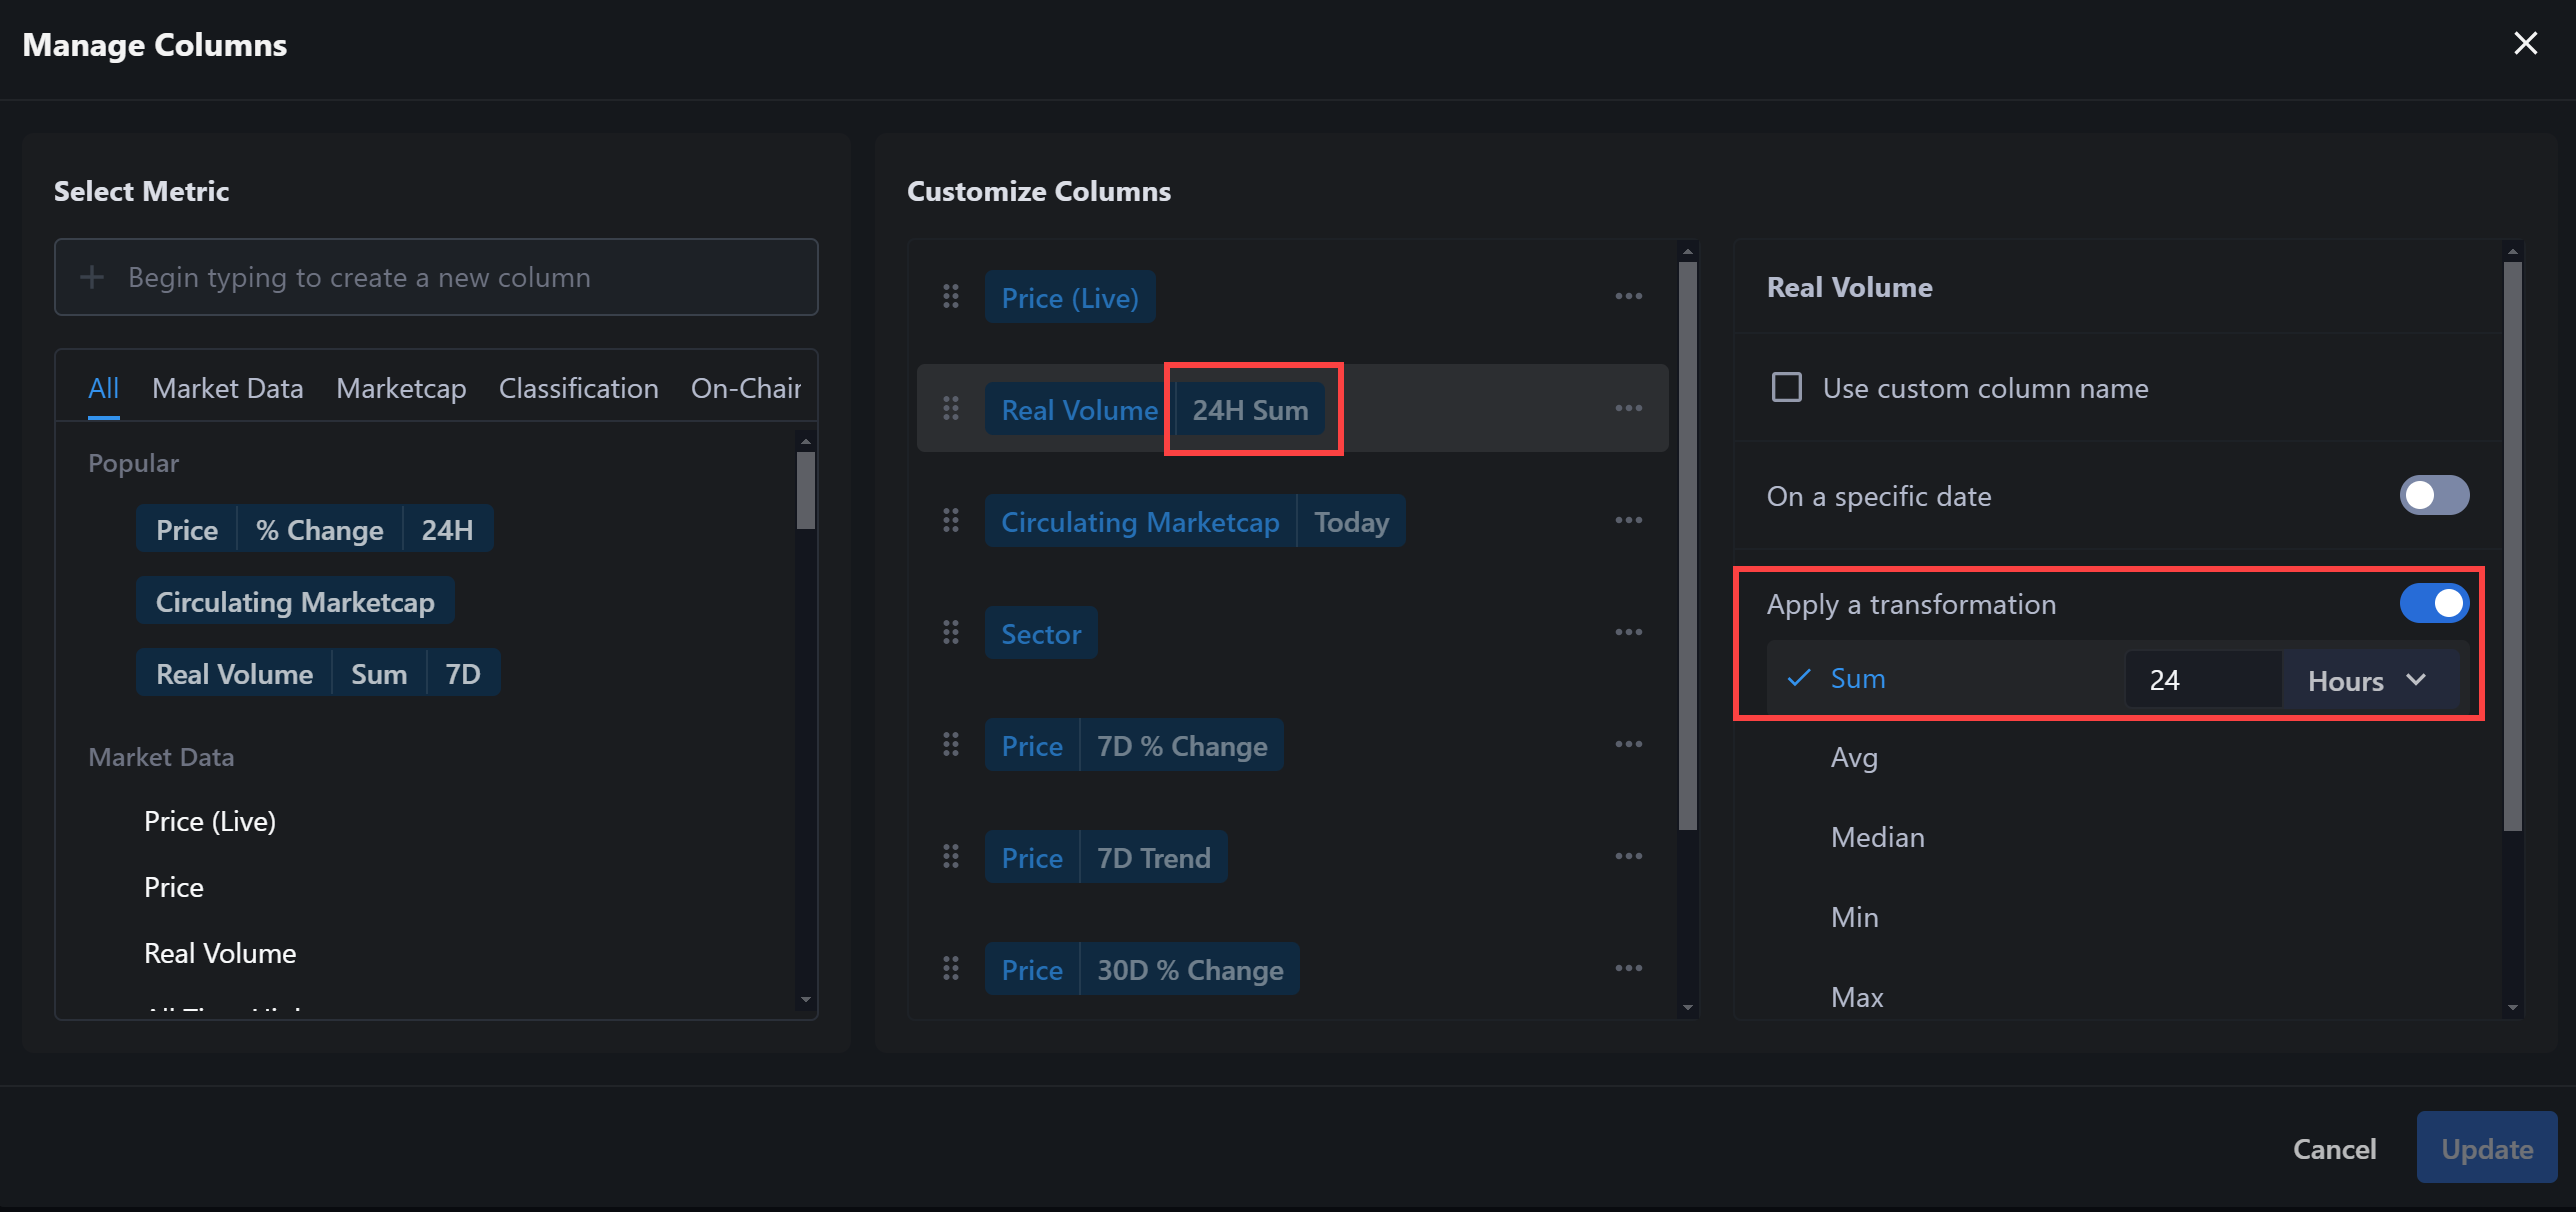

Edit Individual Columns
Similarly, using the dropdown arrow on each column header will allow you to quickly adjust.
Analyze Your Results
Many of the columns in your display table can be sorted by clicking on the column header. For additional analysis the display table offers Previews and Exports as well.Sidebar Previews
Clicking on an Asset name will open the sidebar preview. Previews include a link to the full Project page and a price chart for a quick performance review. Enterprise users can toggle on Notable Event overlays to see the impact of major events on pricing. There is a brief description as well as external links to continue your review.
Exports
CSV Exports are available to Enterprise subscribers. Use the arrow icon in the top right corner of the results table to select a View for export.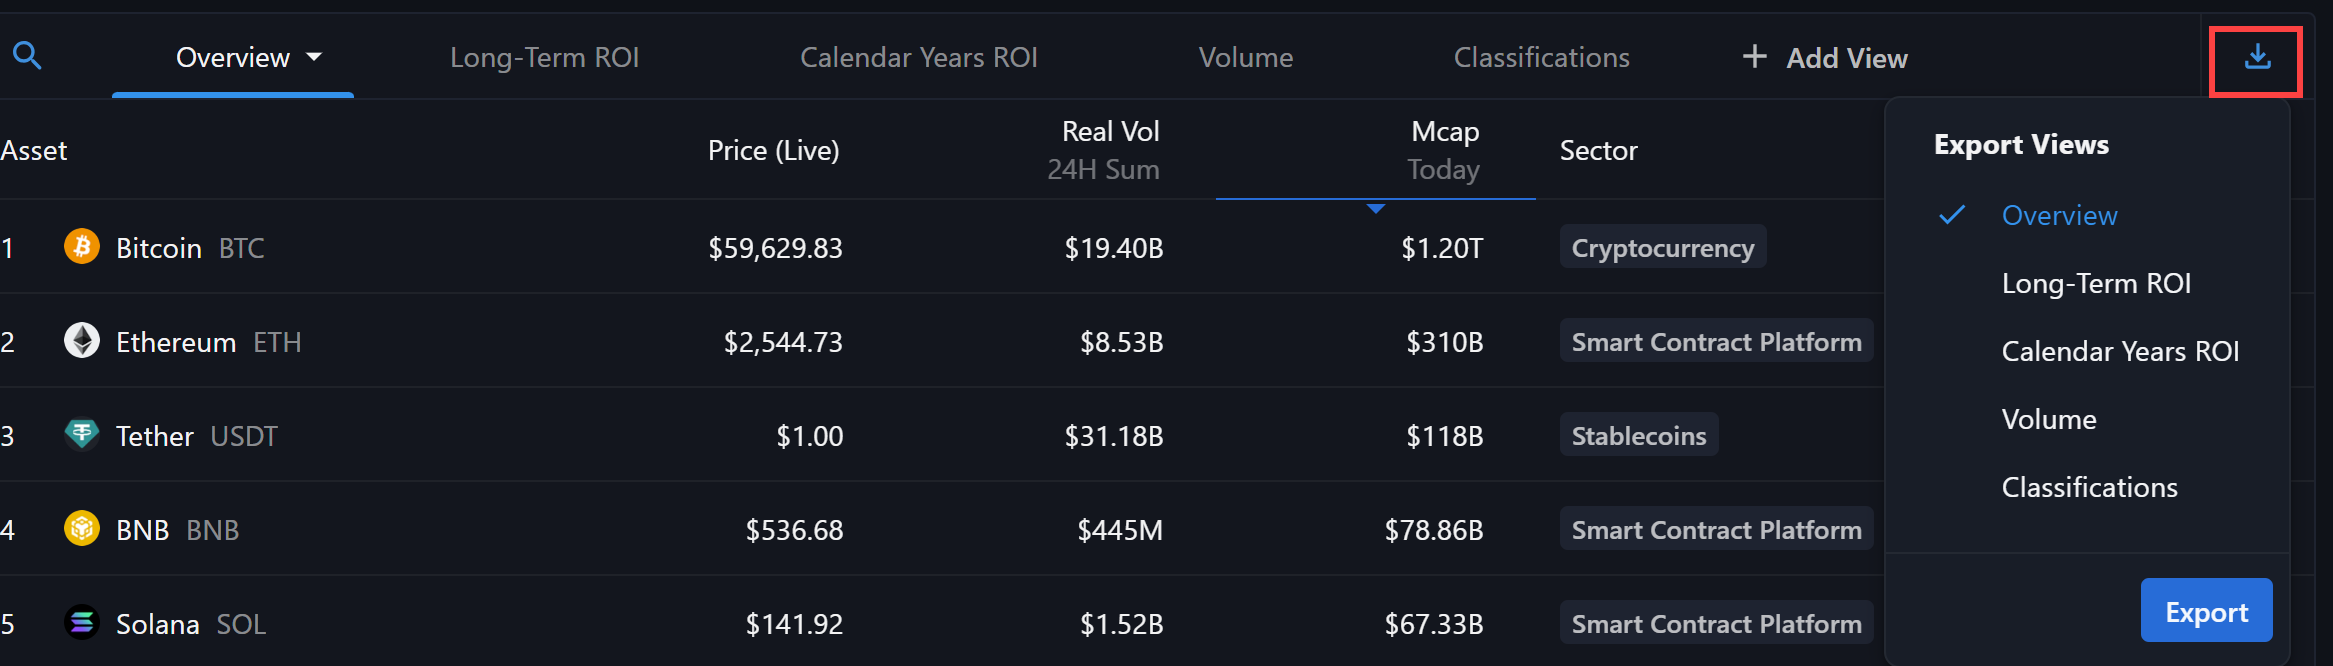
Screener Hot Tips and Best Practices
- When selecting filters, hover over the “i” icon next to the metric name to see a full definition and ensure you’re applying the correct metric for your screen.
- Many users will create a “base” screen to duplicate for future screens. Remember when you are saving your screen it includes the filters you have applied at the top as well as the columns you have customized in the table. Set your initial filters and columns, save your screen, and use that as the “base” to duplicate when creating new screens in the future.
- Instead of starting from scratch, duplicate one of the over 50 sample screens to get started quickly and customize it to your needs.
- Changes are not saved automatically, so remember to save your screen often by clicking the “Save” button.
- In the “Manage Columns” dialog box, drag and drop columns to reorganize them. This helps you display the most relevant metrics at the forefront.
- Easily access your custom screens in the “My Screens” section of the sidebar or the “Home” view for faster retrieval in future sessions.